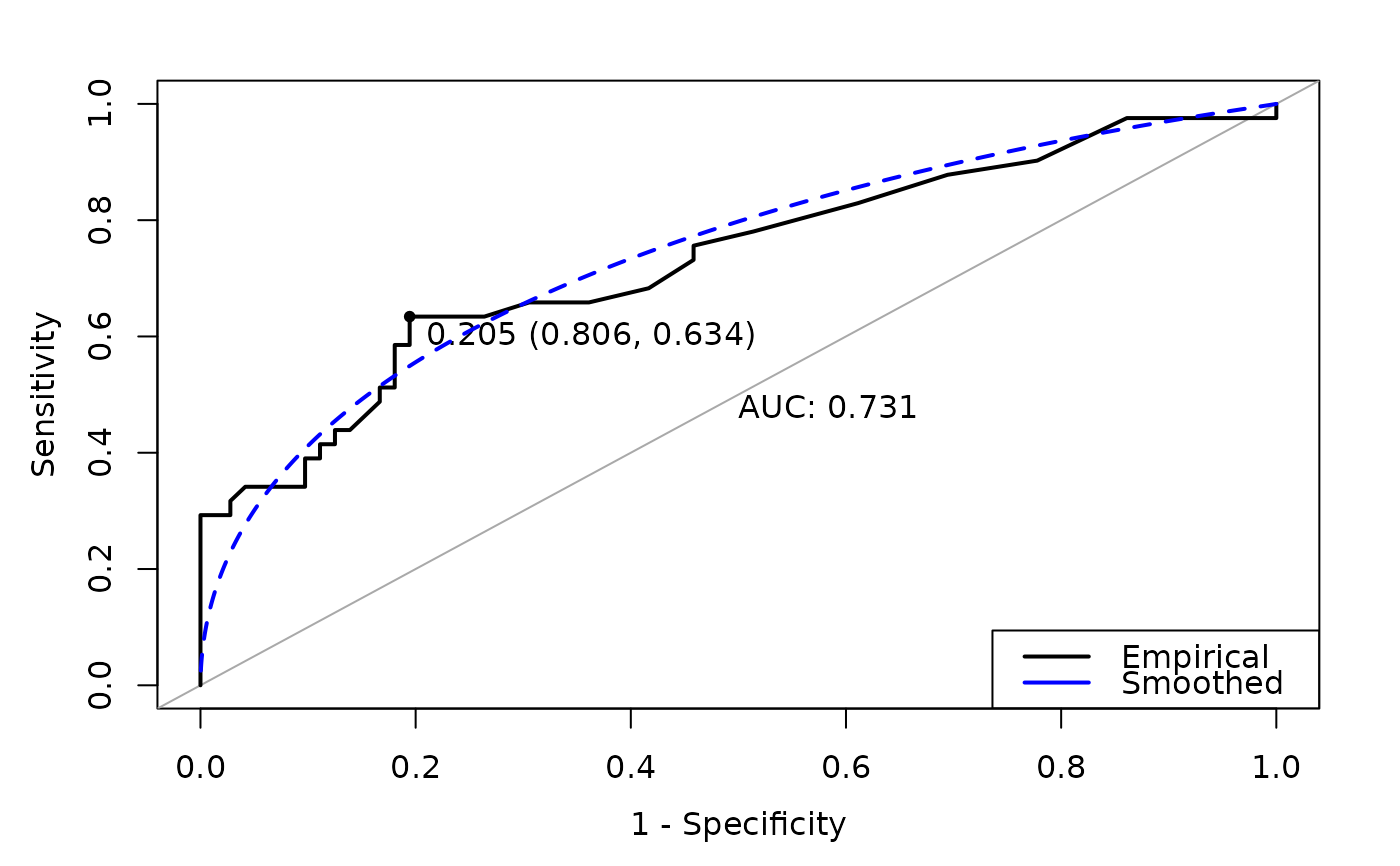
Plots an ROC model
pROC_quick_plot.RdQuickly plots a model based on my own liking
Usage
pROC_quick_plot(
  mod,
  thres_method = c("youden", "closest.topleft"),
  col = "blue",
  ...,
  boots = 0L
)Details
When adding bootstrapped confidence intervals, the core function of `pROC:::ci.sp.roc()` is replaced with a quicker version that uses parallel processing to speed up the bootstraps and some other data manipulation. There will likely be a delay when running with bootstraps.
Examples
if (mark::package_available("pROC")) {
  x <- pROC::aSAH
  mod <- pROC::roc(x$outcome, x$s100b, levels = c("Good", "Poor"))
  pROC_quick_plot(mod)
if (FALSE) { # \dontrun{
  pROC_quick_plot(mod, boots = 100)
} # }
}
#> Setting direction: controls < cases